
PaigePapers | Q3 2026 Insights
Do you know which workforce costs are putting the greatest pressure on your bottom line?
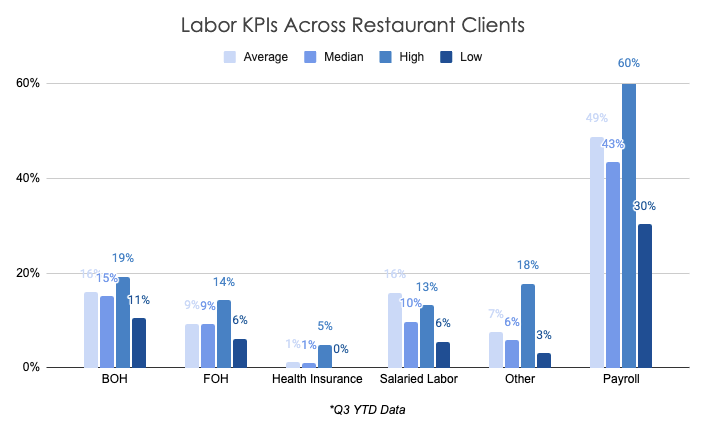
With annual employee turnover near 92% in full-service restaurants, understanding true labor costs is critical for protecting margins. To evaluate these trends, we canvassed our client portfolio to establish real-time performance benchmarks across the first three quarters of the year.
Our findings show total payroll averaged 49% of sales, spanning a wide gap between a 30% low and a 60% high. Across core categories, Back-of-House (BOH) and Salaried labor both averaged 16% of sales, Front-of-House (FOH) averaged 9%, and supporting expenses accounted for the remaining 8% average.
We have seen a few clients achieve a 30% payroll for the first three quarters, which is mainly driven by keeping BOH hourly low. We see the average labor across our portfolio hovers around 50%, which is mainly driven by a combination of additional benefits. These benefits can range from 401(k) programs and health plans to dining cards and FSA benefits.
As we head into the 4th quarter, where sales across the portfolio will be greatest, we will see a dip in the average payroll cost.
Analyzing this breakdown is essential because labor expenses directly dictate bottom-line viability, yet broad payroll numbers often conceal where inefficiencies lie. We recommend comparing your internal BOH hourly, FOH hourly, and salaried metrics against these YTD client averages to pinpoint line-item cost pressures and refine financial forecasts. By adjusting labor scheduling in 2026 to target not only peak sales volume but also cost efficiencies, you can make data-backed budgeting decisions that drive bottom-line results in 2027.
For broader industry context on how turnover and labor costs are impacting restaurant groups, see the featured news highlights below:
Restaurant Groups: Rising Turnover Puts Labor Costs Under Pressure
Restaurant operators continue to face significant labor pressure, with full-service restaurants experiencing hourly employee turnover near 92%. According to workforce benchmark data from Black Box Intelligence, replacing a single hourly employee costs approximately $2,706 in hard costs (covering separation, recruiting, and onboarding/training)—while replacing a General Manager climbs as high as $17,651.
In addition to direct hiring costs, training expenses alone account for 35% of total turnover costs for hourly staff and over 50% for management. Recent research points to workplace burnout, rigid scheduling, and demanding customer service expectations as primary drivers behind employee departures.
Source: Black Box Intelligence (October 2026)
Boutique Hotels: Staffing Shortages Keep Labor in Focus
Hospitality staffing remains a key operational challenge in 2026, even as the U.S. hotel workforce is projected to grow by more than 30,000 jobs this year. Competition remains strong for positions such as housekeepers, food-service workers, cooks, and event staff, while employees are placing greater emphasis on pay, scheduling consistency, commute, and hours.
For boutique hotels, where lean teams can make individual vacancies particularly disruptive, tracking labor cost, overtime, turnover, and staffing levels against occupancy and seasonal demand can help identify where workforce gaps are putting both margins and service levels at risk.
Comparing staffing and overtime costs against occupancy and seasonal demand can help operators distinguish between necessary labor increases and areas where scheduling or staffing efficiency can improve.
Source: Labor Finders (September 2026)
Venture Capital: Navigating Compensation and Labor Pressures
Compensation dynamics across venture capital firms are undergoing a structural shift. Industry workforce benchmarks reveal that average base salaries for Analysts and junior investment roles dropped by up to 20% to 25% year-over-year, driven by AI-enabled workflow efficiencies and leaner team structures. Meanwhile, base pay for Investment Partners rose slightly to average ~$317K, while typical Associate and Principal base salaries hold near $120K to $180K and $200K to $350K respectively.
With carried interest realization timelines remaining extended, cash compensation (funded primarily via management fees) represents the immediate labor cost pressure point for fund managers. Evaluating firm-wide personnel overhead against Assets Under Management (AUM) and fee structures is becoming increasingly essential for building sustainable multi-year operating budgets.
Base salary alone does not capture the full cost of investment talent. Firms should benchmark total compensation, including bonuses and carry, when evaluating staffing budgets and long-term personnel costs.
Source: Venture5 / VC Platform Compensation Benchmark (September 2026)
Private Equity: Compensation Growth Slows as Long-Term Incentives Become Less Predictable
Private equity compensation is facing pressure as slower exits delay carried-interest payouts and make total earnings less predictable. Johnson Associates forecasts no bonus growth for middle-market private equity professionals in 2026, while employees at large buyout firms are expected to see increases of approximately 2.5%–7.5%. By comparison, investment banking bonuses are projected to increase 10%–15%.
For PE firms, these changing compensation dynamics highlight the importance of benchmarking salaries, bonuses, long-term incentives, and retention costs when planning staffing budgets and competing for experienced talent.
As performance-based compensation becomes less predictable, firms may need to pay closer attention to the balance between fixed and variable compensation when evaluating personnel costs and retention strategies.
Source: Johnson Associates / Bloomberg (September 2026)
